top of page

Facility Changes That Drive 80% of Emissions Savings

The overlooked 20% of building strategies can deliver 80% of emissions savings. Here’s how to reset your 2026 baseline.

Ava Montini

Jan 6, 2026

Written by 

Published on

Tags

The 80/20 Pattern in Building Decarbonization


In business, the Pareto principle (the idea that 20% of actions create 80% of results) shows up everywhere. It also applies to the way buildings decarbonize.


Most portfolios still treat carbon reduction as a capital-projects problem: new chillers, new boilers, new equipment. These projects are visible, expensive, and easy to headline in ESG reports. But in practice, the biggest near-term gains lie in the systems that are already running every hour of every day.


According to the U.S. Energy Information Administration, space heating, cooling, and ventilation are among the top energy end-uses in commercial buildings, with ventilation alone consuming nearly 10% of the total building energy. Factor in heating and cooling, and the air systems you already own set the floor for your emissions profile. Industry surveys and guidance reinforce this point: HVAC systems consistently account for approximately 40% of energy use in commercial facilities. A share that shifts by climate zone but remains dominant across the board.


Before you buy new megawatts, make the watts you already use travel a shorter, smarter, more efficient path.


Filtration as a carbon multiplier (not a consumable line item)


Why filtration matters for energy (and CO₂e)

Filters impose a pressure drop; fans work against that resistance. Basic fan/affinity laws tell us that pressure rises with the square of fan speed, and fan power typically scales with pressure/flow requirements. Therefore, adding resistance increases fan energy unless the system compensates by reducing the flow.


On variable-speed systems that maintain flow, peer-reviewed work shows roughly linear fan-power response to added system pressure: a 10% rise in total pressure drop ≈ 10% rise in fan electric power (assumes fan and motor efficiencies roughly constant at operating point). CaEE


Field and lab studies show that higher filter resistance reduces supply airflow and can increase total power (especially as filters load), degrading cooling capacity and forcing longer runtimes. Newer research also documents the compounding effects of filter loading, with heavy clogging cutting net supply airflow by >30%, a textbook example of invisible energy waste. ScienceDirect


Moving up in MERV doesn’t automatically mean higher energy costs. Well-designed filters use optimized media and geometry (like deeper pleats or more surface area) to keep airflow resistance low. Studies have shown that these higher-efficiency filters can have a lower pressure drop than inexpensive MERV 8 pleated filters, especially when systems are properly balanced. In other words, it’s the filter’s pressure profile that matters, not just the MERV number. ScienceDirect


If you can lower your filter pressure drop while maintaining or improving capture, you directly reduce continuous fan energy. One of the few all-hours loads in many facilities. Because fans run whenever you condition or ventilate space, these savings translate cleanly into CO₂e reductions (see Section 5 for the math).


Demand-Controlled Ventilation (DCV)


What DCV does

It modulates outside-air intake based on occupancy (CO₂, people-count, scheduling) to avoid conditioning empty spaces. Codes and standards increasingly require or encourage DCV in high-occupancy areas, with ASHRAE 62.1 updates clarifying when and how ventilation turndown is permitted (including addenda that allow reduction to zero OA during verified unoccupied periods in certain space types). ASHRAE


Across building types and climates, published work shows that DCV control logic achieves ~9–33% HVAC energy savings. Advanced rooftop-unit control packages, which incorporate multi-speed/variable fans, DCV, and smarter economizer control, have delivered double-digit fan and cooling savings, sometimes exceeding 20%. Taylor & Francis Online


Lawrence Berkeley National Laboratory (LBNL) analyses flag that cost-effectiveness depends on the baseline over-ventilation and occupancy patterns; if your current minimums are already close to code, savings shrink. That’s a guidance feature, not a flaw—the point is to measure your baseline VRs before projecting benefits. Energy Technologies Area


DCV is a surgical lever: attack over-ventilation where it exists, prove reductions with trend data, and lock in permanent load reductions; especially valuable in heating-dominated regions where conditioning outside air is expensive in both energy and CO₂e. Energy Codes Guide


Preventative Maintenance


Controls drift, coils foul, dampers stick, sensors mis-calibrate—quietly taxing 5–15% of portfolio energy in many studies. Modern fault detection & diagnostics (FDD) tools and structured maintenance programs quickly recapture that waste. NREL Docs


  1. Coil fouling: Government and academic sources document material energy penalties from dirty coils; some guidance cites compressor energy up to ~30% higher with fouled condensers (case and climate dependent). Even conservative findings confirm meaningful efficiency and capacity degradation. Avoidable with routine cleaning. Energy.gov.au


  2. Economizers & OA paths: Mis-tuned economizers are common and costly; retuning and sensor QA via FDD is repeatedly highlighted in DOE/NREL/PNNL guidance as a top-tier low-cost fix. PNNL


  3. RTU controls refresh: Campaign results and tech briefs demonstrate that advanced RTU control (variable fan, DCV, and economizer optimization) consistently yields energy reductions of more than 20%, with 25–50% reductions cited in certain deployments compared to legacy constant-speed, always-open baselines. Better Buildings Solution Center


Maintenance is mitigation. It’s also Scope 3-friendly: operating equipment at design efficiency extends service life and defers replacements, reducing embodied carbon churn in your capital plan. (See the measurement plan below to make these savings auditable.)


Turning kWh into CO₂e: a quick, defensible method

Your sustainability stakeholders care about tons, not watts. To translate HVAC savings into CO₂e:

  1. Quantify energy from the measure (e.g., fan kWh drop from low-pressure filters; heating/cooling kWh or therms saved from DCV; kWh saved from FDD fixes).

  2. Apply grid or fuel emission factors appropriate to the site(s) and year.

    • U.S. electricity (2022 eGRID avg): ≈ 0.393 kg CO₂/kWh (867.5 lb/MWh delivered). US EPA+1

    • Canada electricity (2025 factors) vary widely by province—e.g., Ontario: 38 g CO₂e/kWh; Alberta: 490 g CO₂e/kWh. Selecting the right regional factor matters. Canada.ca


If a low-pressure filter reduces fan energy by ~300 kWh/year per unit (magnitude depends on hours, fan size, and baseline pressure):

  • U.S. eGRID avg: 300 kWh × 0.393 kg/kWh ≈ 118 kg CO₂e/year per filter.

  • Ontario: 300 kWh × 0.038 kg/kWh ≈ 11 kg CO₂e/year per filter.

This is why portfolios across different grids see very different CO₂e per kWh outcomes. Even when the kWh savings are identical. US EPA


For transparency in ESG filings, reference the EPA eGRID subregion or the Government of Canada tables (or your utility-specific factors) and archive the PDFs used for each reporting year. US EPA


Risk management & IAQ alignment

  • Stay within ASHRAE 62.1 minimums at all times when spaces are occupied. DCV is about right-sizing, not starving air. Updated addenda clarify occupancy-based turndown rules—use them. ASHRAE

  • Filter choices: Seek equal or higher capture with lower ΔP; measure clean and loaded ΔP at your own face velocities. Research shows energy impact depends on filter design and system configuration, not only MERV. ScienceDirect

  • Measurement culture: Treat IAQ and energy as co-optimized objectives by trending PM, CO₂, temperature, and fan power together, so nobody is flying blind.


What this unlocks for 2026 capex

Once you bank the operational tons above, the economics of electrification, heat recovery, and heat pumps improve because you’re sizing for reduced loads. DOE/NREL work on advanced RTU control consistently shows meaningful kWh reductions when variable fans and DCV are layered in—think of these as pre-project multipliers that de-risk later capex. NREL Docs


The Power of the Overlooked 20%

In the rush to decarbonize, it’s tempting to chase the biggest, newest technologies. But the truth is that many of the most reliable carbon savings are already within reach. Hidden in fans, filters, ventilation rates, and maintenance routines.


Filtration, demand-controlled ventilation, and preventative maintenance may not make the headlines, but together they represent the overlooked 20% of actions that can deliver 80% of your emissions savings. They are measurable, repeatable, and scalable across portfolios, exactly the kind of solutions facility leaders need as they enter a new year of climate commitments.

How Peak Demand Shapes Building Costs, Emissions, and Operations

  • Writer: Ava Montini
    Ava Montini
  • Jul 15, 2025
  • 5 min read

By mid-July, the weather forecast stops being small talk. It becomes operational.


With heat domes intensifying across North America and grid operators issuing near-daily alerts, facility and portfolio managers are paying closer attention and for good reason.


Ontario’s IESO issued more peak warnings before August than in the entire 2022 season. In 2024, Texas broke its own energy demand record 10 times. According to the U.S. Energy Information Administration, commercial buildings in the U.S. now consume around 35% of the nation’s electricity, making this sector a key player in shaping grid performance during high-load periods.


Energy usage is showing up beyond the utility bill; in Scope 2 emissions disclosures, tenant expectations, and stakeholder audits. With grid volatility rising and energy performance now directly tied to financial exposure and emissions visibility, organizations are starting to reassess how energy decisions are made, tracked, and reported.


Energy, increasingly, is functioning as a real-time indicator of how integrated and responsive a business truly is.


Energy Has Left the Boiler Room

By now, it is well known in commercial real estate that energy data now reaches beyond utility bills. It now plays a role in broader business decisions, even if that shift has happened gradually.


According to CBRE’s 2024 Global Investor Intentions Survey, 59% of respondents now factor sustainability-linked performance into their investment evaluations. Energy efficiency specifically was cited as a way to protect long-term value, something increasingly relevant as operating costs and emissions reporting become more closely tied.


This kind of performance data doesn’t just stay within the engineering team. It’s showing up in investor due diligence, influencing lease terms, and being used to support eligibility for green financing or incentive programs.


What also matters is how efficiency is tracked, shared, and applied to meet business goals. Consistent performance during peak periods, clear Scope 2 reporting, and reliable internal coordination are becoming expected, especially in markets under regulatory or stakeholder pressure.


These are no longer emerging trends. They’re baseline expectations for any organization managing significant energy loads.


A Few Hours Can Shape Your Annual Energy Spend


Many commercial buildings are billed not just for how much energy they use, but when they use it.


In most North American markets, utilities and grid operators apply what's called "peak demand pricing," a system that looks at a facility’s electricity use during the most critical periods on the grid, typically when demand is at its highest and supply is tightest. These peak periods often occur during extreme heat events or late afternoons in the summer.


Utilities use these moments to assess each building’s contribution to overall grid stress. That data is then used to determine a portion of the facility’s charges for the following year, often under separate line items like demand charges, capacity tags, or grid contribution fees.


In Ontario, for instance, a commercial building’s Global Adjustment (GA) charges are based on its electricity load during the five highest one-hour demand periods between May and October. These hours aren’t announced in advance, but are predicted with some accuracy by monitoring weather and grid forecasts. The IESO uses this data to assign an "ICAP tag," which influences your facility’s GA cost over the next billing cycle.


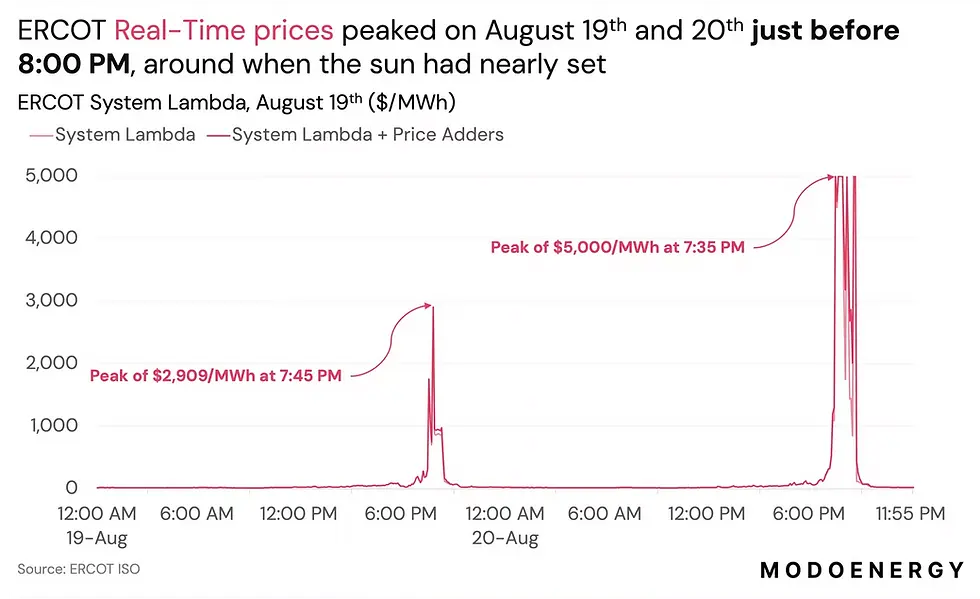
In the U.S., several regional transmission organizations (RTOs) such as PJM, ISO-NE, ERCOT, and NYISO use similar methods. ERCOT’s 4CP (Four Coincident Peaks), for example, calculates charges based on your facility’s usage during four peak hours—each occurring on the highest-demand day in June, July, August, and September.


These billing models are especially impactful in sectors with high energy intensity or round-the-clock operations: healthcare, food storage, manufacturing, data centers. In these cases, those few hours can account for 30% to 70% of the annual electricity bill, depending on rate structure and local regulations.


Unlike fixed charges, these costs can be actively managed. Facilities that have visibility into upcoming peak periods and a plan to temporarily reduce load—even by 5% to 10%—can significantly cut future costs and improve their carbon reporting by reducing emissions during grid-critical periods.


Grid Strain Is Becoming More Common


During 2024, regional electricity demand hit new highs across North America, and the pace is changing how energy is managed today.


In Texas, ERCOT reached a record 85,931 MW of demand on August 20, 2024, surpassing its previous all-time high set the year before. This surge wasn’t a one-off. In May 2025, ERCOT warned that demand might exceed 84,000 MW, potentially challenging the previous May record of 77,000 MW. These numbers reflect rising load from data centers, EV charging, and increased AC usage, raising the stakes for flexibility in facility operations.


In Ontario, 2024 brought a similar trend. Warmer-than-usual summer temperatures led to 277 peak hours above 20,500 MW demand. Double the 138 hours seen in 2023. Meanwhile, refurbishments at nuclear plants and reduced imports forced the grid to rely more on gas generation. These factors have introduced more volatility into rate structures and heightened the risk for assets that lack demand-side flexibility.


July Offers a Useful Midpoint for Evaluation

By this stage in the summer, most large energy users have had at least one or two opportunities to respond to a peak event. This creates a natural checkpoint.


  • Was your team prepared?

  • Did the systems respond as expected?

  • Were load reduction strategies discussed across departments, or handled in isolation?


Demand charges alone can represent 30–70% of a commercial customer’s total electricity costs, and adopting time-based rate strategies has enabled many to reduce peak usage by around 16% on average, sometimes reaching up to 40% 


Performance Is Increasingly Measured in Real Time

As ESG reporting becomes more sophisticated, energy data is being tracked and evaluated at a finer level of detail. The Greenhouse Gas Protocol now encourages organizations to report Scope 2 emissions using time-based methods that reflect when electricity is consumed and how carbon-intensive the grid is at that hour.


Temporary spikes during peak demand periods can now influence not just emissions totals, but also eligibility for incentive programs and performance-based certifications. LEED and ENERGY STAR, for example, have begun placing more emphasis on interval data and how buildings perform under real operating conditions.


For property managers and sustainability leads, being able to show avoided demand during grid-stressed hours adds credibility to reporting.


As the second half of summer unfolds, the patterns emerging now, how buildings respond, how teams coordinate, and how data is tracked, will quietly shape the months ahead. Even without sweeping changes, the season offers a chance to observe, adjust, and carry forward what proves useful.


Energy may be a technical input, but increasingly, it reflects how an organization works under pressure and where it’s headed next.


Explore expert insights, stay up-to-date with industry events, and gain a deeper understanding of the developments shaping the built environment.

Subscribe to our monthly newsletter below for exclusive early access to Blade's Insights content.

Insights Hub

Lorem ipsum dolor sit amet, consec tetur adipiscing elit. Sit quis auctor 

Lorem ipsum dolor sit amet cotetur 

Lorem ipsum dolor sit amet, consec tetur adipiscing elit. Sit quis auctor 

Lorem ipsum dolor sit amet cotetur 

Lorem ipsum dolor sit amet, consec tetur adipiscing elit. Sit quis auctor 

Lorem ipsum dolor sit amet cotetur 

bottom of page